Palo Alto
Palo Alto-specific dashboard details. For shared concepts — variables, base query structure, direction tabs, action analysis — see the Dashboard Guide.
Dashboards
| Dashboard | File | Description |
|---|---|---|
| Traffic | traffic-panos.json | Session/connection analysis |
| Threat | threat-panos.json | Security event analysis (virus, spyware, IPS, URL) |
| Data | ingest-panos.json | Ingestion health and throughput |
| Log Fields | log-fields-panos.json | Raw field explorer |
| Streams | streams-panos.json | Data stream statistics |
Variables
All common variables are documented in the Dashboard Guide. PAN-OS specifics:
| Variable | Notes |
|---|---|
vsys | Virtual System from panos.vsys — equivalent to FortiGate's vdom |
type | Hardcoded per dashboard: "TRAFFIC" in Traffic, "THREAT" in Threat. No policytype equivalent |
Traffic Dashboard
The Traffic dashboard organizes analysis across two dimensions: direction (outer tabs) and metric type (inner sub-tabs).
Metric Sub-tabs
Within each direction tab, two sub-tabs slice the same traffic data by a different primary metric:
| Sub-tab | Primary aggregation | Source|Destination tabs |
|---|---|---|
| Sessions | count() — one log ≈ one connection | IP · User|Host |
| Bytes | sum(network.bytes) · sum(network.packets) · sum(panos.elapsed) | IP only |
No User|Host tab in Bytes
User identity and device data is not available in the Bytes sub-tab — only IP-level volume attribution is shown.
Sessions Tab
Follows the standard panel hierarchy. PAN-OS-specific panels within each row:
Source | Destination — IP
| Source | Destination | Description |
|---|---|---|
source.ip | destination.ip | Top IPs by session count |
source.ip/24 | destination.ip/24 | Top /24 subnets by session count |
source.nat.ip | destination.nat.ip | NAT-translated addresses |
unique destination.ip by source.ip | unique source.ip by destination.ip | Fanout — distinct IPs reached / reaching each endpoint |
unique network.transport_port by source.ip | unique network.transport_port by destination.ip | Port diversity — high values suggest scanning |
unique network.application by source.ip | unique network.application by destination.ip | Application diversity per endpoint |
Source | Destination — User | Host
Palo Alto combines user identity (from User-ID) and device fingerprinting (from GlobalProtect) into a single tab.
| Source | Destination | Description |
|---|---|---|
source.user.name | destination.user.name | Authenticated user (from User-ID) |
panos.src_host | panos.dst_host | Device hostname |
panos.src_osfamily | panos.dst_osfamily | OS family (Windows, macOS, Android…) |
panos.src_osversion | panos.dst_osversion | OS version |
panos.src_vendor | panos.dst_vendor | Hardware vendor |
panos.src_category | panos.dst_category | Device category (laptop, phone, printer…) |
Bytes Tab
Mirrors the Bytes tab structure in the Traffic dashboard, with PAN-OS field naming differences.
Bytes | Packets | Duration Row
| Sub-row | Panels |
|---|---|
sum | sum(network.bytes) and sum(network.packets) timeseries |
histogram | Distribution histograms for bytes, packets, and panos.elapsed |
elapsed vs duration
PAN-OS uses panos.elapsed for session duration — the ECS fgt.duration equivalent.
Source | Destination — IP (Bytes)
Each panel group has Sum and Avg inner tabs:
| Panel group | Fields |
|---|---|
| Bytes by address | bytes source.ip · bytes source.ip/24 · bytes source.nat.ip · bytes destination.ip · bytes destination.ip/24 · bytes destination.nat.ip |
| Elapsed by address | elapsed source.ip · elapsed source.ip/24 · elapsed source.nat.ip · elapsed destination.ip · elapsed destination.ip/24 · elapsed destination.nat.ip |
Application (Bytes)
Each panel has Sum and Histogram inner tabs:
| Panel | Description |
|---|---|
bytes network.transport_port | Bytes by protocol/port |
bytes network.application | Bytes by detected application |
bytes panos.container_of_app | Bytes by container app |
bytes panos.category_of_app | Bytes by application category |
elapsed network.transport_port | Connection duration by port |
elapsed network.application | Connection duration by application |
elapsed panos.category_of_app | Connection duration by category |
Interfaces / Zones Row
The Interfaces / Zones row uses chord diagrams (esnet-chord-panel) — a visualization unique to PAN-OS with no FortiGate equivalent. These show traffic flow relationships between pairs:
| Panel | Field | Description |
|---|---|---|
| Zone-to-zone | observer.ingress.zone.name by observer.egress.zone.name | Session volume between security zones |
| Interface-to-interface | observer.ingress.interface.name by observer.egress.interface.name | Physical/logical interface pair flows |
Chord diagrams are particularly useful for understanding traffic routing and verifying zone policy coverage.
Threat Dashboard
The Threat dashboard focuses on security engine events (virus, spyware, IPS, URL filtering, file blocking).
Tab Structure
Unlike FortiGate's UTM dashboard where rows are conditionally shown/hidden by subtype, PAN-OS uses a tab-per-subtype structure with all rows always visible. It adds a summary tab not present in FortiGate:
| Tab | Purpose |
|---|---|
summary | Aggregated view across all threat subtypes |
$subtype | Dynamic per-subtype tab — repeats for each active subtype (virus, spyware, vulnerability, url, etc.) |
Threat Rows
All rows are always visible — scope is driven by the direction and subtype tab selection rather than conditional rendering:
| Row | Notes |
|---|---|
| Metrics | Always visible |
| Subtype | Breakdown by panos.subtype and panos.severity — plus a correlation panel linking subtype to session end reason |
| Rule | Policy attribution |
| Geo | Country geomaps |
| Threat ID | Threat Category | Misc | panos.threatid, panos.threat_category, severity breakdown |
| Source | Destination | IP and user analysis |
| Application | Service and application breakdown |
Action
Palo Alto separates action (what the firewall decided) from session_end_reason (why the session ended). This differs from FortiGate where both collapse into fgt.action.
This distinction matters in Traffic analysis: panos.action tells you what the policy decided, while panos.session_end_reason tells you what actually terminated the session — which can differ when a threat is detected mid-session on an otherwise allowed flow. panos.flags encodes session properties (symmetric return, decrypted, captive portal, etc.) that provide additional context.
Traffic Field reference: Traffic Log Fields — key fields: action, session_end_reason, flags.
Threat Field reference: Threat Log Fields — key fields: action, flags.
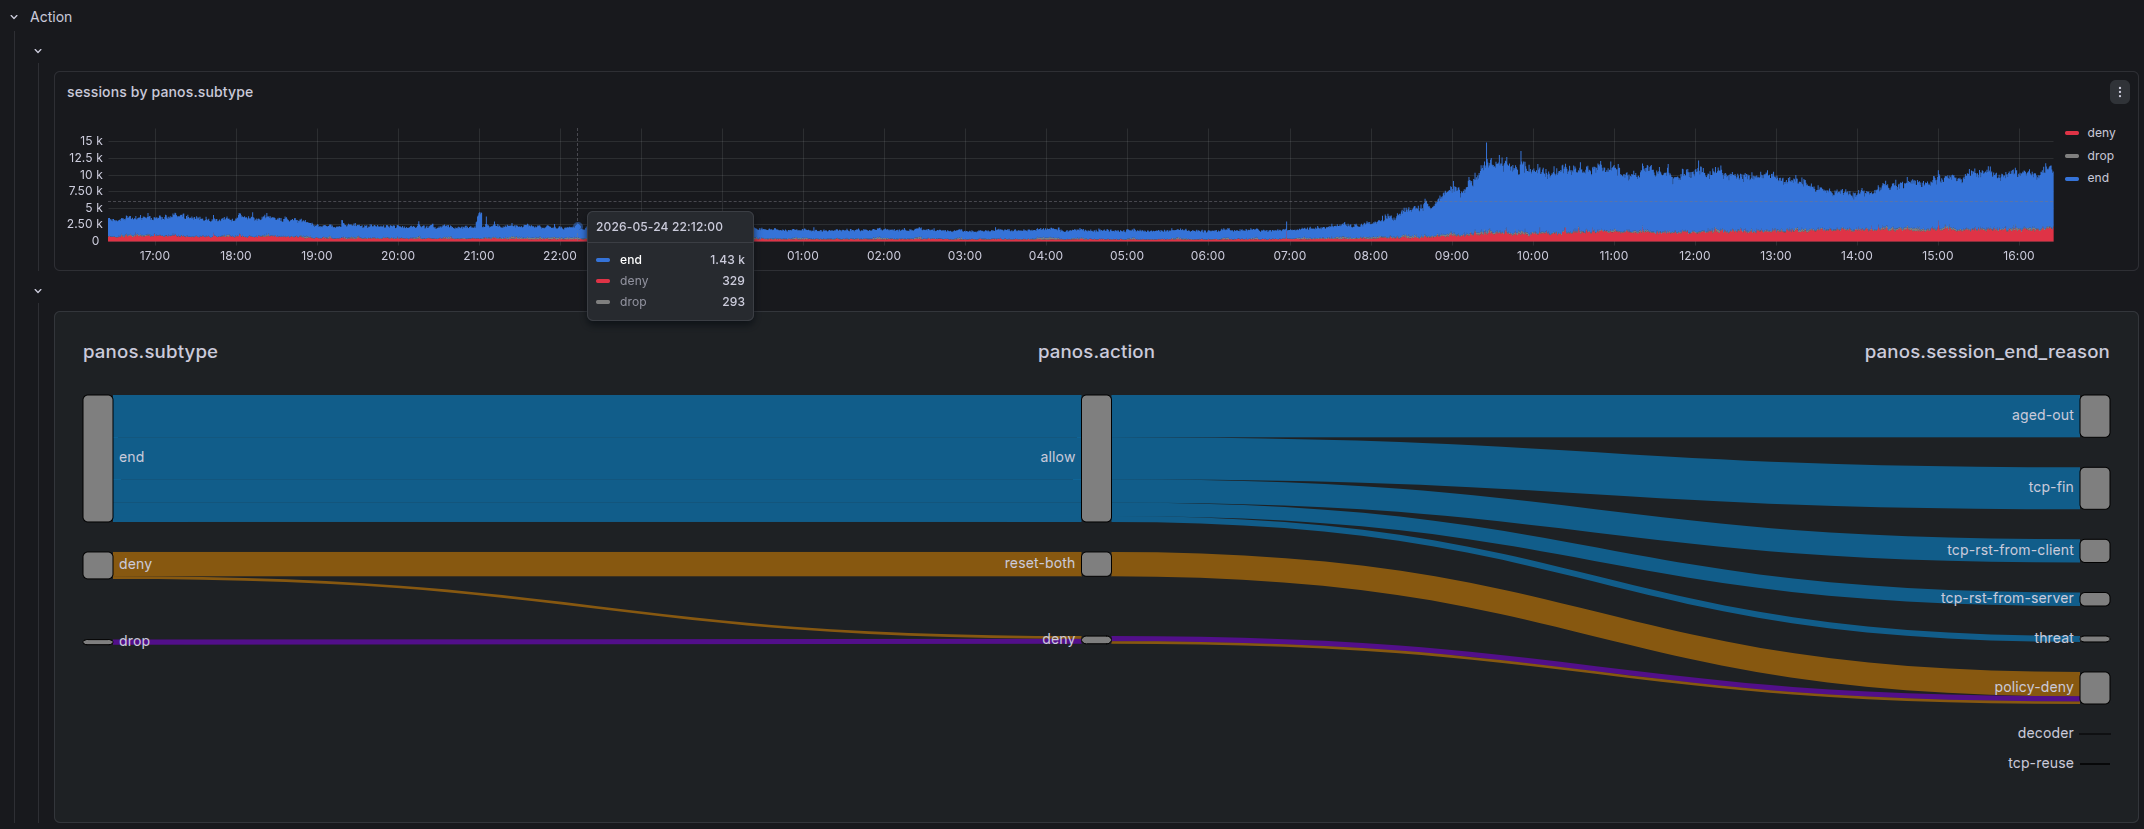
Sankey Diagram
Both Traffic and Threat dashboards use a Sankey diagram to visualize the relationship between:
This is the primary way to answer: "when a threat was detected, what did the firewall actually do, and how did the session end?"
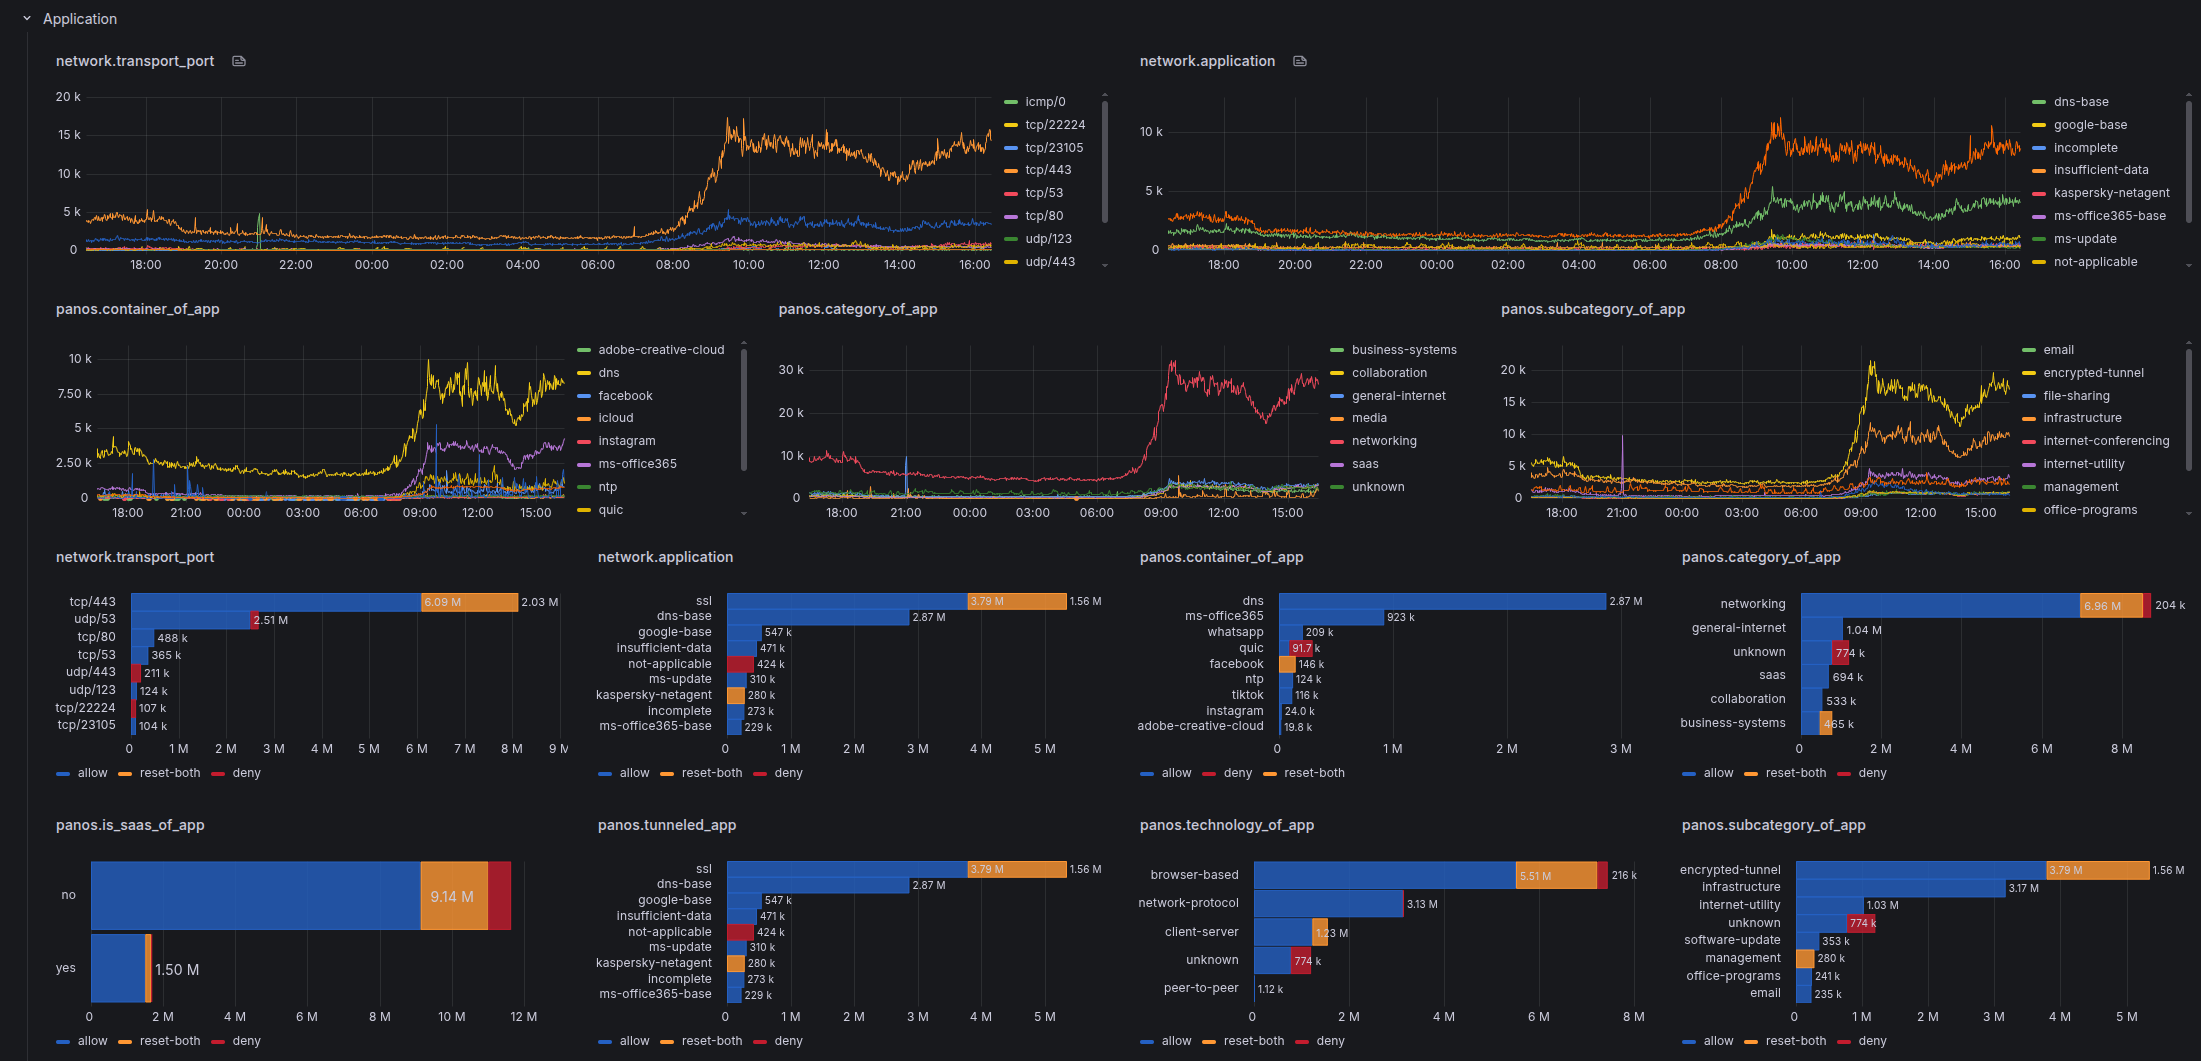
Service | Application
PAN-OS deep packet inspection classifies applications with significantly richer metadata than FortiGate:
| Field | Description |
|---|---|
network.application (panos.app) | Detected application name |
panos.category_of_app | Application category |
panos.subcategory_of_app | Application sub-category |
panos.technology_of_app | Underlying technology (browser-based, client-server, etc.) |
panos.container_of_app | Parent application container |
panos.tunneled_app | Application tunneled inside another |
panos.risk_of_app | Risk level (1–5) |
panos.characteristic_of_app | Behavioral characteristics (transfers-files, tunnels-other-apps, etc.) |
panos.is_saas_of_app | SaaS classification |
panos.sanctioned_state_of_app | Whether the app is sanctioned by policy |
Overrides
Action Colors — Traffic
Traffic action values use a color scale that reflects severity of intervention — blue for permissive, shades of orange/red for resets, solid red for hard blocks, gray for silent drops:
| Color | Action values |
|---|---|
| Dark blue | allow |
| Dark red | block, deny |
| Gray | drop, drop-ICMP — silent drop, no RST sent |
| Orange | reset-both |
| Dark orange | reset-client |
| Light orange | reset-server |
Action Colors — Threat
Threat action values use a finer-grained scale reflecting both the threat response and URL/WildFire-specific actions:
| Color | Action values |
|---|---|
| Blue | allow, continue |
| Dark blue | override |
| Light orange | alert, block-continue |
| Orange | reset-client, syncookie-sent |
| Semi-dark orange | reset-server |
| Dark orange | reset-both |
| Red | block-ip |
| Semi-dark red | drop |
| Dark red | deny, block-url, block |
| Super-light red | random-drop |
| Purple | block-override |
| Dark purple | sinkhole, override-lockout |
Severity Colors
panos.severity uses a traffic-light scale across both Traffic and Threat dashboards:
| Color | Severity |
|---|---|
| Gray / Semi-dark blue | informational |
| Green | low |
| Orange | medium |
| Red | high |
| Dark red | critical |
Unit Scaling
Identical to FortiGate dashboards:
| Pattern | Unit |
|---|---|
*bytes | Decimal bytes — auto-scales to KB, MB, GB |
*packets | SI short — auto-scales to K, M, G |
*duration / *elapsed | Duration format (s, m, h) |