FortiGate
FortiGate-specific dashboard details. For shared concepts — variables, base query structure, direction tabs, action analysis — see the Dashboard Guide.
Dashboards
| Dashboard | File | Description |
|---|---|---|
| Traffic | traffic-fortios.json | Session/connection analysis |
| UTM | utm-fortios.json | UTM engines analysis |
| System | system-fortios.json | Health metrics, configuration changes, and login/logout attempts |
| SSL VPN | ssl-vpn-fortios.json | VPN session analysis: tunnel establishment, user connections, duration, and traffic |
| Data | ingest-fortios.json | Ingestion health and throughput |
| Log Fields | log-fields-fortios.json | Raw field explorer |
| Streams | streams-fortios.json | Data stream explorer |
Variables
All common variables are documented in the Dashboard Guide. FortiGate adds two variables not present in PAN-OS:
| Variable | Notes |
|---|---|
policytype | From fgt.policytype — typically policy. Traffic-only, no UTM equivalent |
crscore | Switch variable — applies a risk score threshold filter when enabled. Traffic and UTM only |
Traffic Dashboard
The Traffic dashboard organizes analysis across two dimensions: direction (outer tabs) and metric type (inner sub-tabs).
Metric Sub-tabs
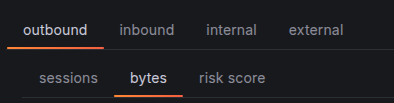
Within each direction tab, three sub-tabs slice the same traffic data by a different primary metric:
| Sub-tab | Primary aggregation | Source|Destination tabs |
|---|---|---|
| Sessions | count() — one log ≈ one connection | IP · User · Device |
| Bytes | sum, avg, p90, histogram for network.bytes, network.packets, fgt.duration | IP · User |
| Risk Score | sum(fgt.crscore) — cumulative Threat Weight | IP · User · Device |
Sessions Tab
Follows the standard panel hierarchy. FortiGate-specific panels within each row:
Source | Destination — IP
| Source | Destination | Description |
|---|---|---|
source.ip | destination.ip | Top IPs by session count |
source.ip/24 | destination.ip/24 | Top /24 subnets by session count |
source.nat.ip | destination.nat.ip | NAT-translated addresses — useful for identifying NAT pools |
unique destination.ip by source.ip | unique source.ip by destination.ip | Fanout — distinct IPs reached / reaching each endpoint |
unique network.transport_port by source.ip | unique network.transport_port by destination.ip | Port diversity — high values suggest scanning |
fgt.srcreputation | fgt.dstreputation | FortiGuard IP reputation score |
Source | Destination — User
FortiGate collects user identity from authentication sessions (FSSO, RSSO, local auth) and maps it to traffic.
| Source | Destination | Description |
|---|---|---|
fgt.user | fgt.dstuser | Authenticated user |
fgt.unauthuser | fgt.dstunauthuser | Unauthenticated user (identity known, not authenticated) |
fgt.unauthusersource | fgt.dstunauthusersource | Method used to identify the unauthenticated user |
fgt.group | fgt.dstgroup | User group |
fgt.authserver | fgt.dstauthserver | Authentication server |
fgt.srcname | fgt.dstname | Device hostname |
Source | Destination — Device
Device fingerprinting for both source and destination, populated when FortiGate identifies the device via DHCP, FSSO, or traffic inspection.
| Source | Destination | Description |
|---|---|---|
fgt.srcname | fgt.dstname | Device hostname |
fgt.devtype | fgt.dstdevtype | Device category (PC, Phone, Printer, etc.) |
fgt.osname | fgt.dstosname | OS name |
fgt.srcswversion | fgt.dstswversion | OS version |
fgt.srchwvendor | fgt.dsthwvendor | Hardware vendor |
fgt.srcfamily | fgt.dstfamily | Device family |
Bytes Tab
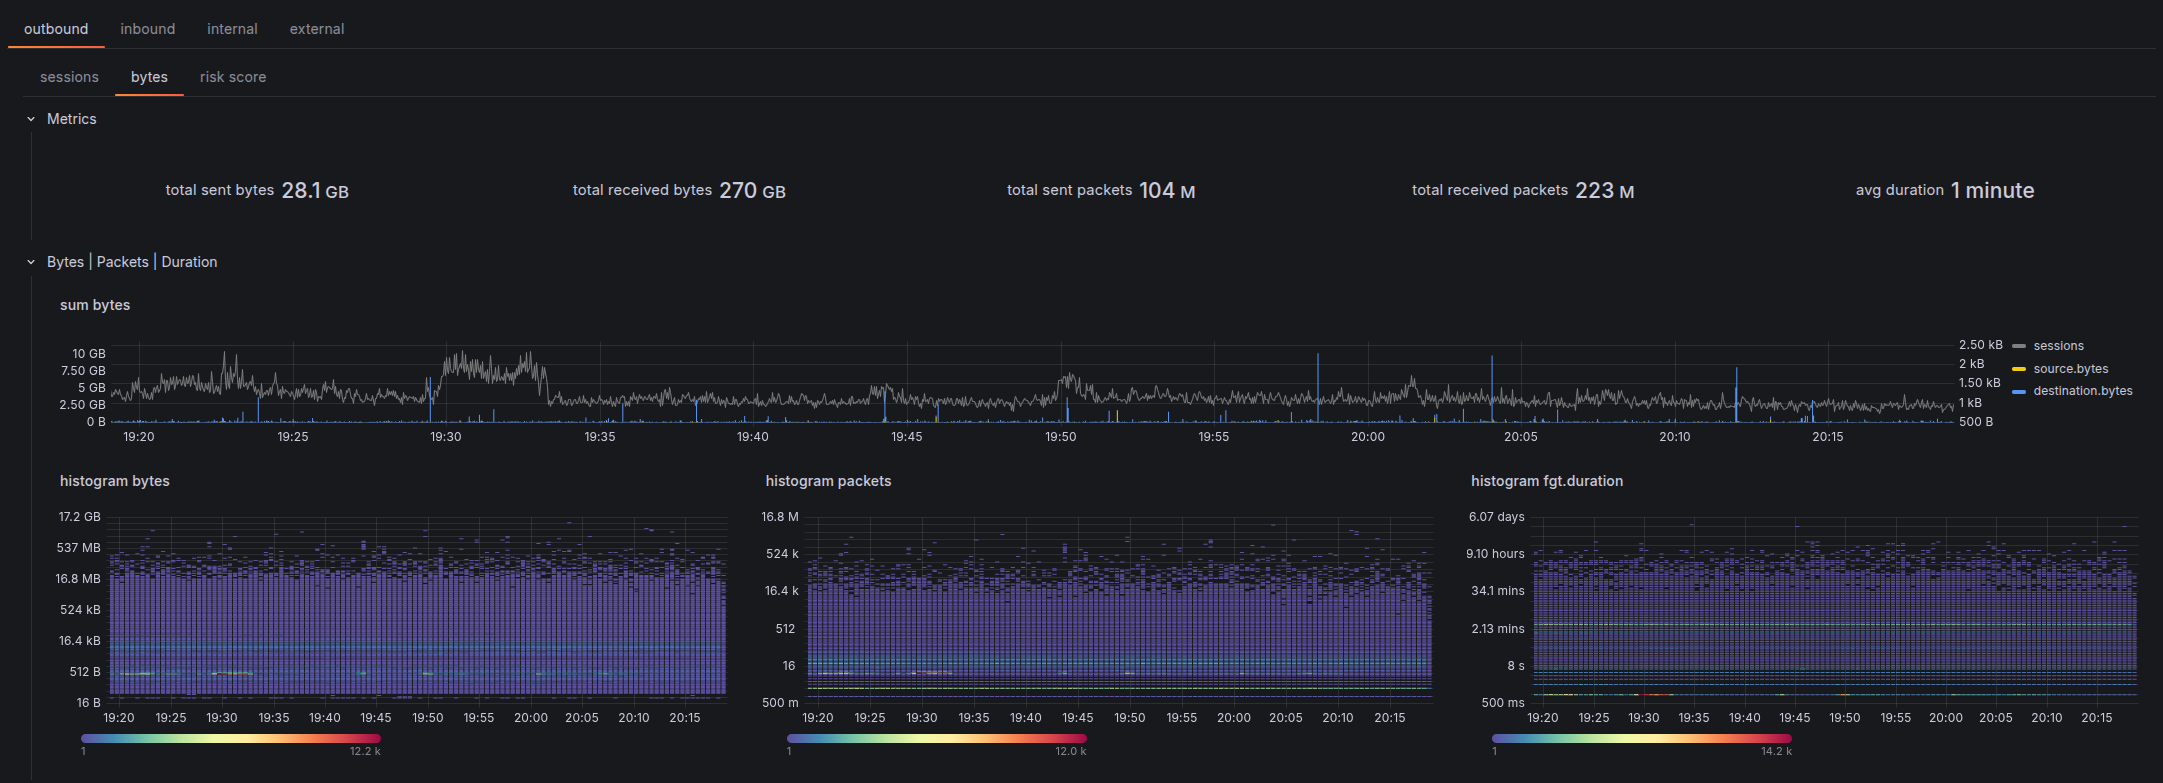
The Bytes tab replaces session counts with volume and duration metrics. It adds a dedicated Bytes | Packets | Duration row that sits above the standard Geo / Interfaces / Rule rows.
Bytes | Packets | Duration Row
| Sub-row | Panels |
|---|---|
sum | sum(network.bytes) and sum(network.packets) timeseries |
histogram | Distribution histograms for bytes, packets, and fgt.duration |
The histograms show the shape of the distribution — useful for spotting bimodal patterns (e.g. small keep-alive packets mixed with large file transfers) that averages would hide.
Source | Destination — IP (Bytes)
Each panel group has Sum and Avg inner tabs:
| Panel group | Fields |
|---|---|
| Bytes by address | bytes source.ip · bytes source.ip/24 · bytes source.nat.ip · bytes destination.ip · bytes destination.ip/24 · bytes destination.nat.ip |
| Duration by address | duration source.ip · duration source.ip/24 · duration source.nat.ip · duration destination.ip · duration destination.ip/24 · duration destination.nat.ip |
Source | Destination — User (Bytes)
| Panel group | Fields |
|---|---|
| Bytes by user | bytes fgt.user · bytes fgt.unauthuser · bytes fgt.group · bytes fgt.dstuser · bytes fgt.dstunauthuser · bytes fgt.dstgroup |
| Duration by user | duration fgt.user · duration fgt.unauthuser · duration fgt.group · duration fgt.dstuser · duration fgt.dstunauthuser · duration fgt.dstgroup |
Application (Bytes)
Each panel has Sum and Histogram inner tabs:
| Panel | Description |
|---|---|
bytes network.transport_port | Bytes by protocol/port (e.g. tcp/443) |
bytes fgt.service | Bytes by service name (see service field caveat) |
bytes network.application | Bytes by detected application |
bytes fgt.appcat | Bytes by application category |
Risk Score Tab
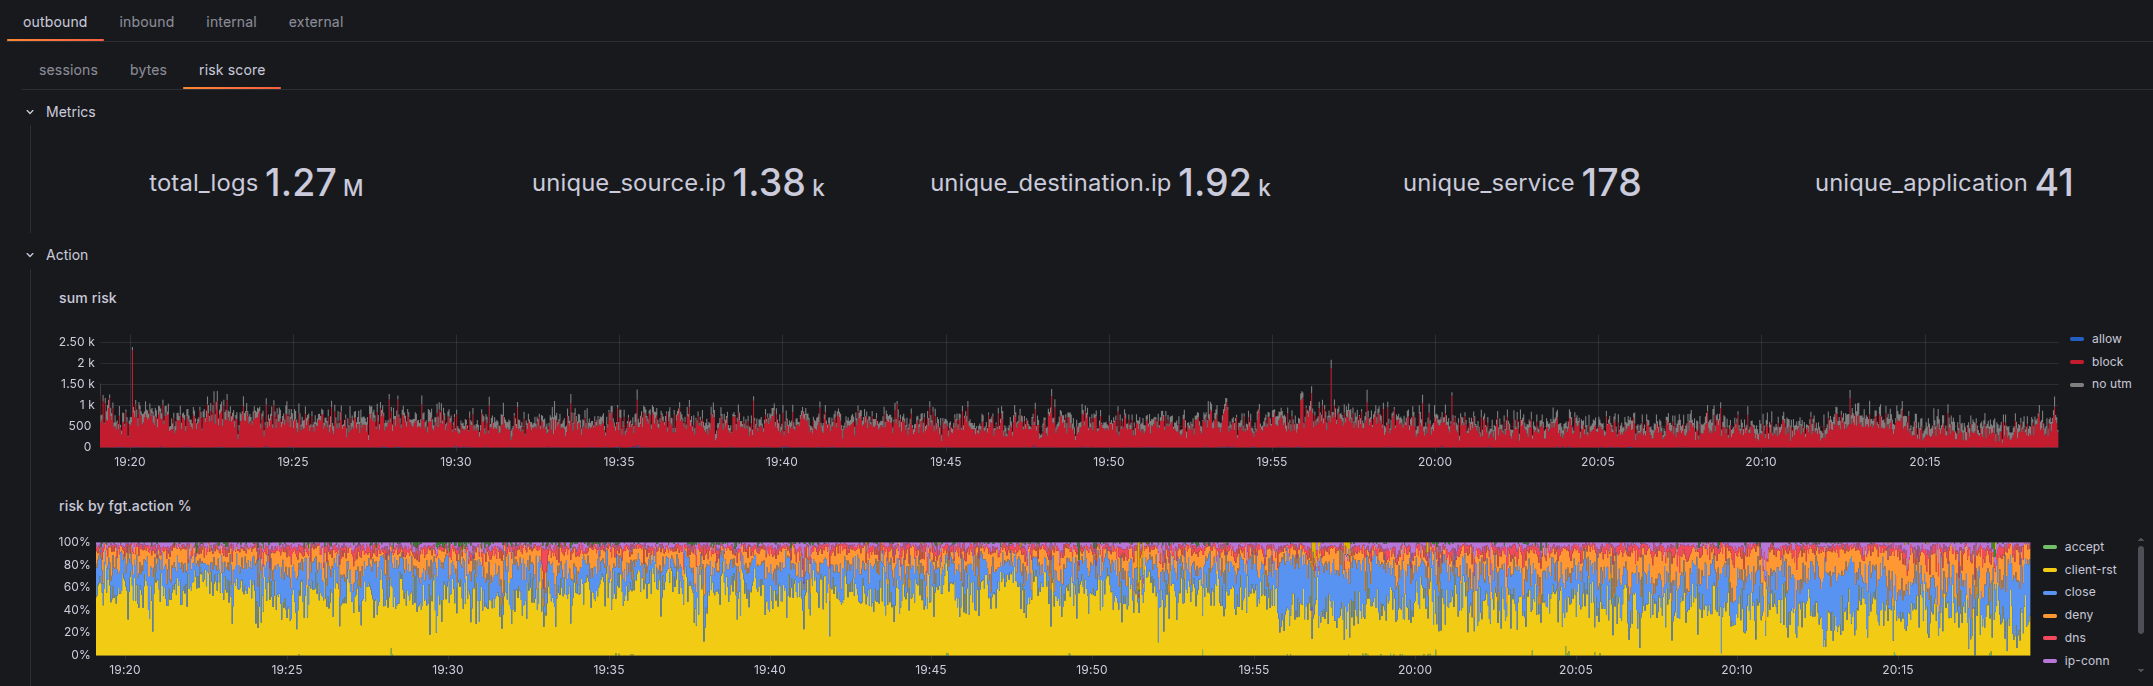
Mirrors the Sessions tab structure — same rows (Metrics, Action, Rule, Geo, Interfaces, Source|Destination with IP/User/Device, Application) — but aggregates sum(fgt.crscore) instead of count().
Key panels specific to this tab:
| Panel | Description |
|---|---|
sum risk | Total cumulative Threat Weight score over time |
risk by fgt.action % | Risk score distribution across action values |
Use this tab to surface which sources or destinations accumulate the most risk weight, even when their session counts are low. A single high-scoring session may not appear in the Sessions top-10 but will dominate the Risk Score view.
Interfaces Row
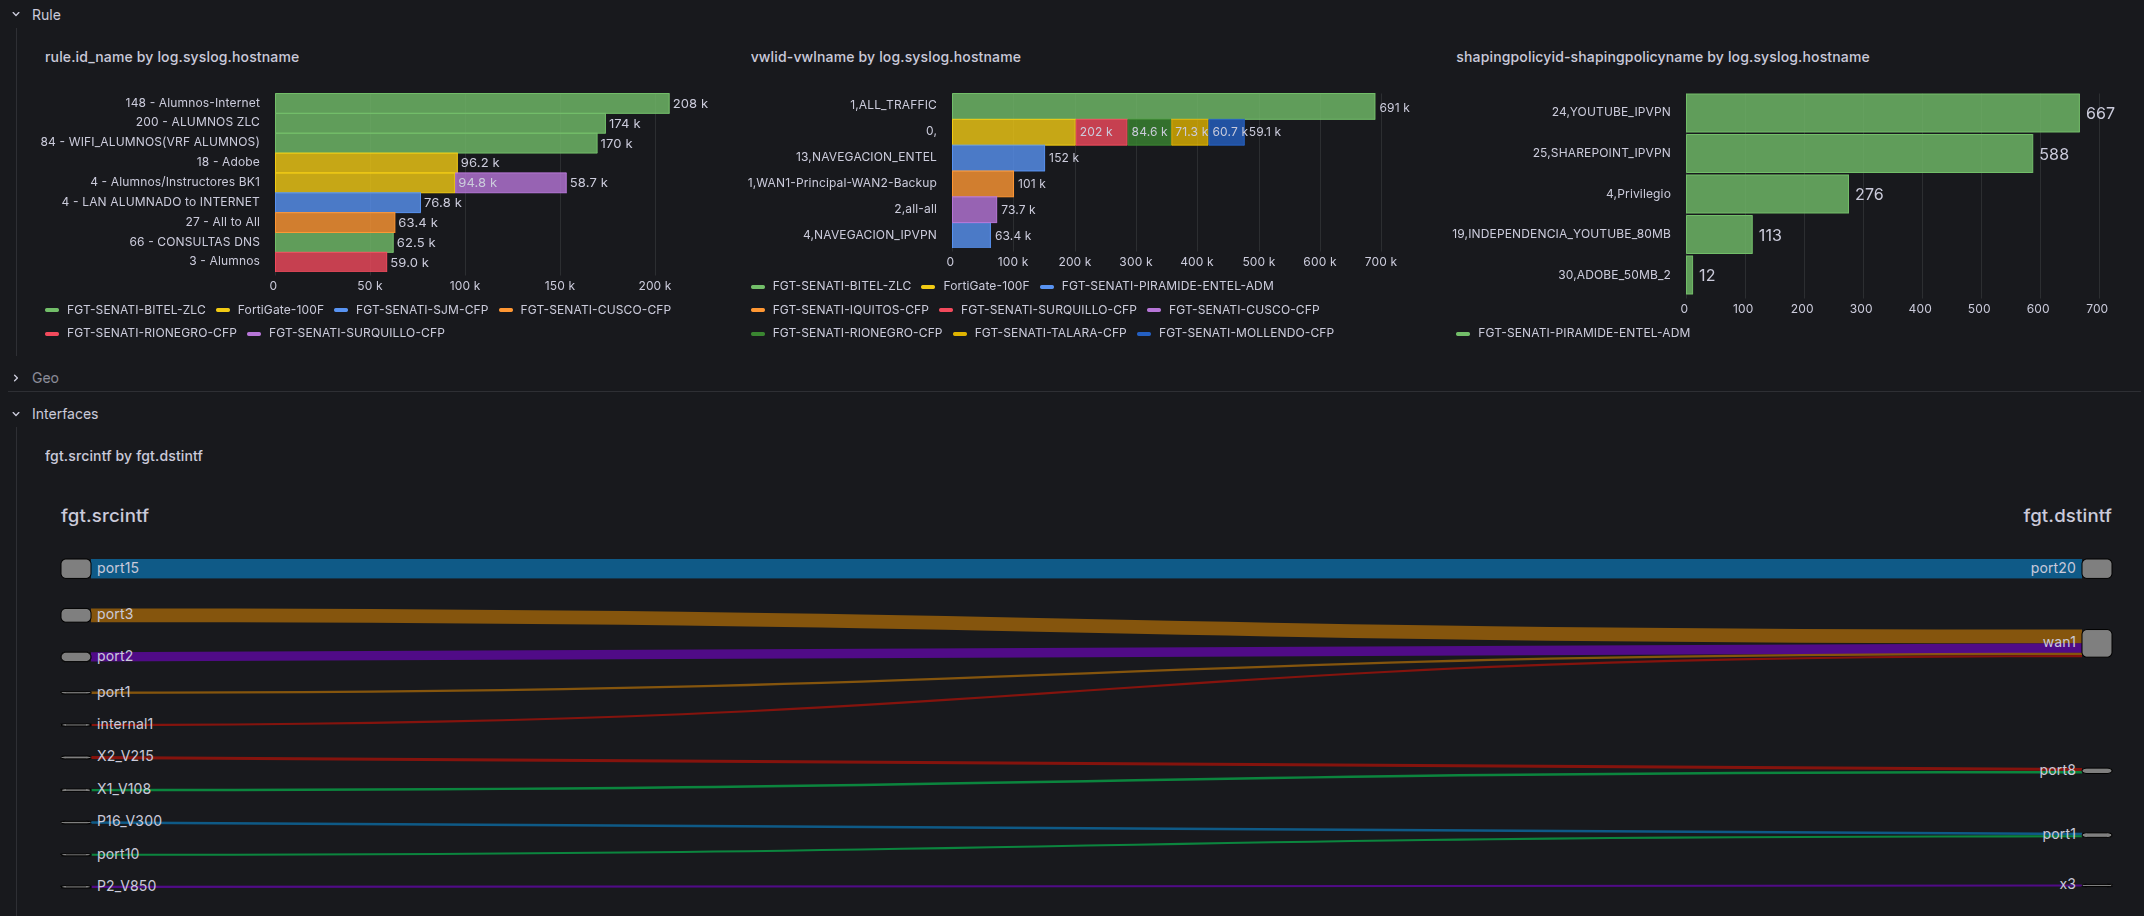
Present in all three sub-tabs. Maps traffic to network topology:
| Panel | Field | Use case |
|---|---|---|
| Interface pair | fgt.srcintf by fgt.dstintf | Traffic volume between interface pairs |
| SD-WAN rule | vwlid-vwlname by log.syslog.hostname | SD-WAN rule attribution per firewall |
| Shaping policy | shapingpolicyid-shapingpolicyname by log.syslog.hostname | Traffic shaping / QoS policy matches |
The SD-WAN and shaping panels are only populated on deployments using those features.
UTM Dashboard
The UTM dashboard focuses on security engine events. It uses the same direction-based outer tab as Traffic, with a dynamic $subtype inner tab that repeats per active subtype in the data.
crscore Variable
A switch variable unique to this dashboard. When enabled, it injects a risk score threshold filter into the base query — toggling between "all UTM events" and "high-risk UTM events only" without modifying queries manually.
UTM Engines
Rows are conditionally shown or hidden based on the active subtype. This is a deliberate design decision: each UTM engine produces different fields, so showing all rows at once would leave most panels empty. The dashboard renders only the rows relevant to the selected subtype:
| Row | Always visible | Visible when subtype is… |
|---|---|---|
| Metrics | ✓ | — |
| General | ✓ | — |
| Geo | ✓ | — |
| Source | Destination | ✓ | — |
| User Agent | URL | Category | app-ctrl, webfilter, file-filter, ssl | |
| Application | Application Category | app-ctrl | |
| File | Virus | Virus Category | virus | |
| Attack | Severity | URL | ips | |
| Resolved IP | Question Name | dns | |
| matchfilename | matchfiletype | file-filter |
Action
Action values in security event logs reflect what the security engine did with the threat, not the firewall policy decision.
System Dashboard
Three top-level tabs covering different event subtypes:
Health
Per-firewall health metrics. The row repeats for each selected $firewall, showing system resource utilization over time.
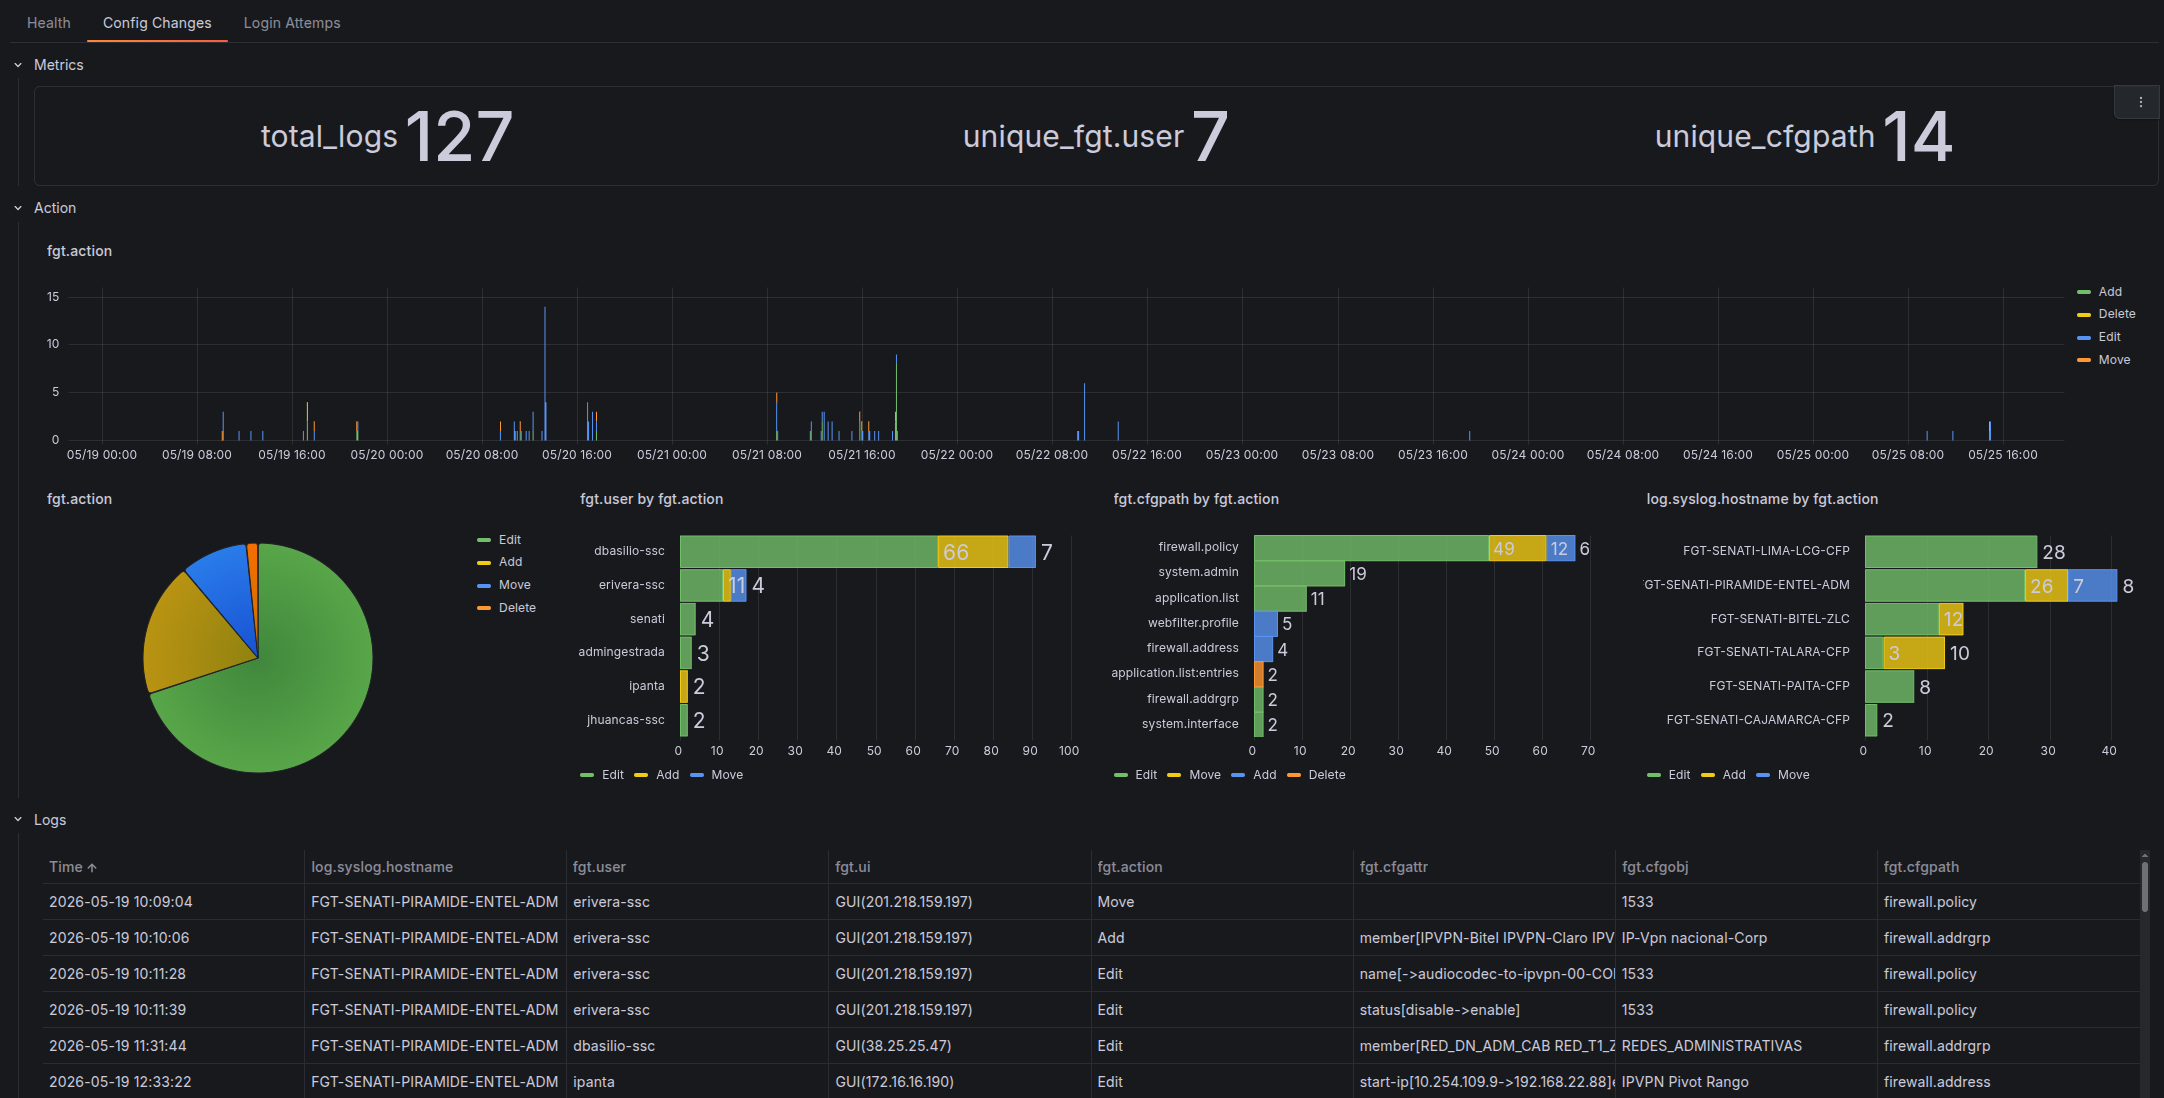
Config Changes
Covers fgt.subtype=config events — administrative changes to the firewall configuration.
| Row | Content |
|---|---|
| Metrics | Total config change count |
| Action | Timeseries and absolute breakdown by fgt.action (add, edit, delete) |
| Logs | Raw log table for investigation |
Login Attempts
Covers admin login events (fgt.subtype=login).
| Row | Content |
|---|---|
| Metrics | Total login event count |
| Log Description | Breakdown by fgt.logdesc — login success, login failed, etc. |
| Users | Top users by login attempt count — timeseries and absolute |
SSL VPN Dashboard
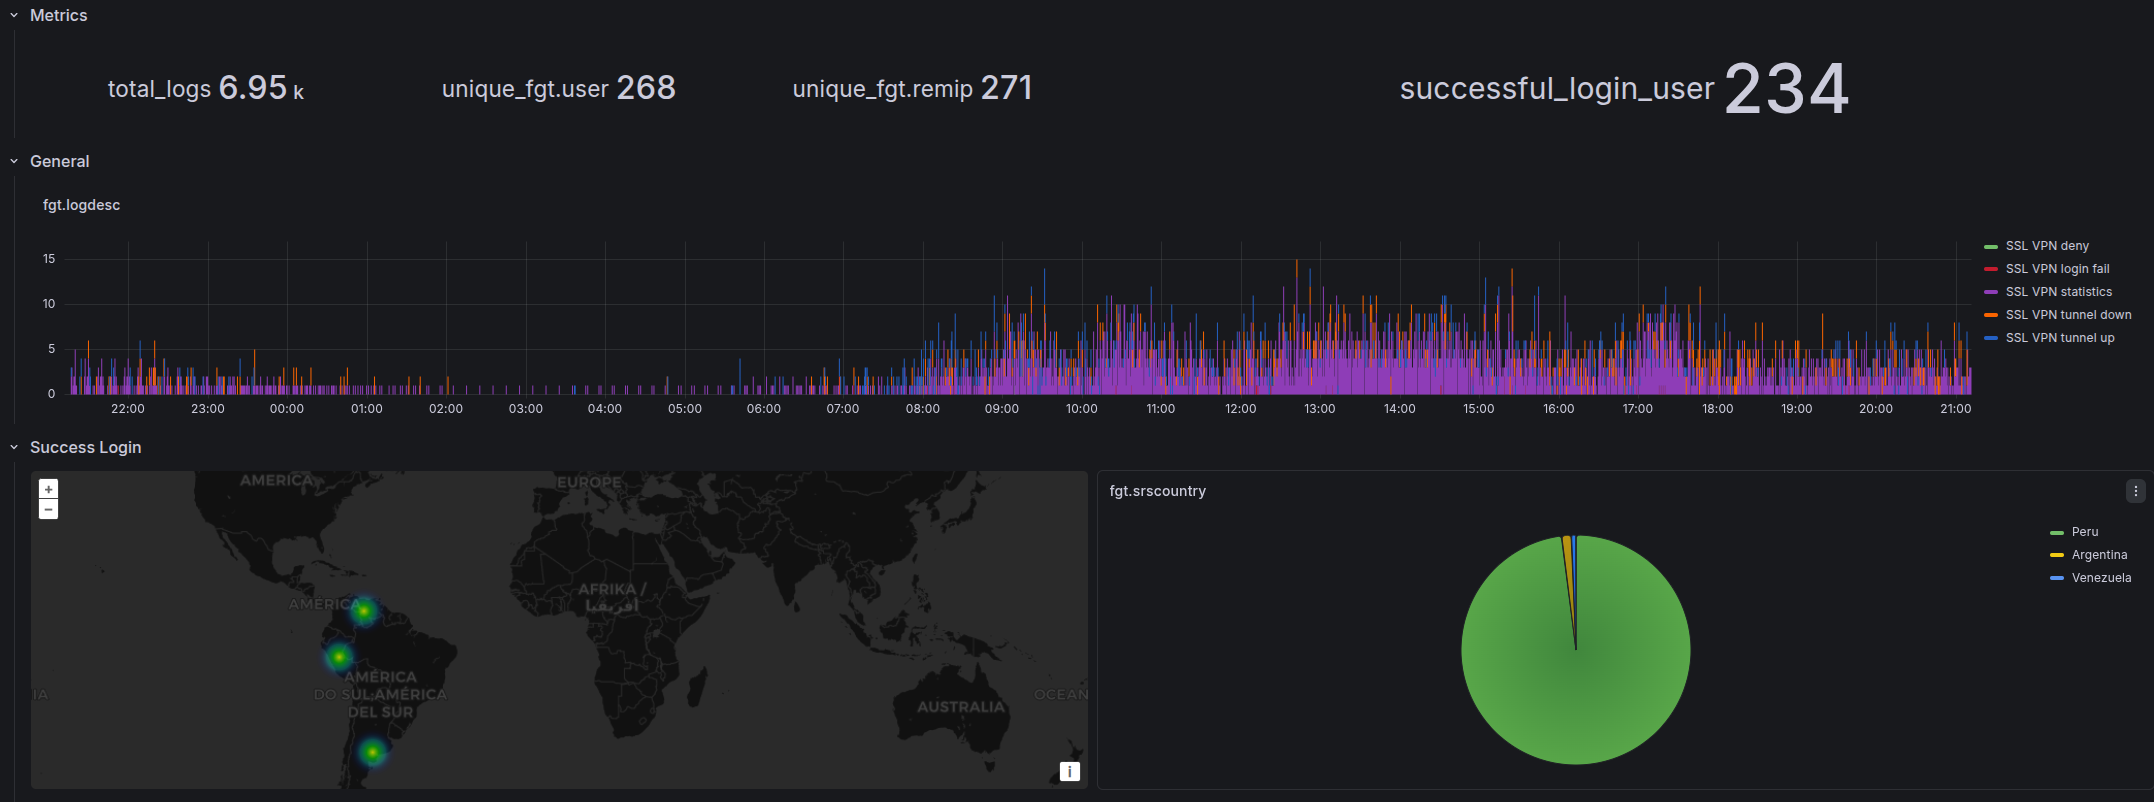
No direction tabs — SSL VPN sessions are always inbound by nature. Four rows:
| Row | Content |
|---|---|
| Metrics | Active users, login users, total connection duration |
| General | fgt.user · fgt.reason · fgt.logdesc summary panels |
| Success Login | Geo map + timeseries + absolute: top users, remote IPs (fgt.remip), countries |
| Fail Login | Same structure filtered to failed events; includes fgt.reason for termination |
The Success / Fail split makes it easy to spot brute-force patterns (high fail count from a single remote IP) vs legitimate usage.
Service | Application
Service Field
fgt.service can hold three different values depending on what matched:
- An Internet Service name (e.g.
Google-DNS) — if the destination matched a Fortinet Internet Service database entry - A configured service object name (e.g.
HTTPS,CUSTOM-APP) — if the session matched a policy service object - A protocol/port notation (e.g.
tcp/443) — if no service object matched
This inconsistency makes fgt.service unreliable for aggregation: the same port can appear under three different values depending on how the policy is configured. Use network.transport_port instead.
Overrides
Action Colors
Action values are color-coded consistently across all bar chart and timeseries panels. The convention is blue = permissive, red = blocking.
Traffic
| Color | Action values |
|---|---|
| Blue | allow |
| Red | block |
UTM
Full UTM action value descriptions are documented in the action_descriptions.csv.
| Color | Action values |
|---|---|
| Blue | allow, pass, passthrough, permit, exempt, pass_session, monitored, analytics, detected, log-only |
| Red | block, blocked, dropped, reject, reset, reset_client, reset_server, drop_session, deny, ban, ban-sender, quarantine-ip, quarantine-interface |
Unit Scaling
Fields are auto-scaled based on their name pattern:
| Pattern | Unit |
|---|---|
*bytes | Decimal bytes — auto-scales to KB, MB, GB |
*packets | SI short — auto-scales to K, M, G |
*duration | Duration format (s, m, h) |