Dashboard Guide
Both vendors share the same set of dashboards, each with a distinct purpose:
| Purpose | FortiGate | Palo Alto |
|---|---|---|
| Traffic session analysis | Traffic [FortiOS] | Traffic [PAN-OS] |
| Security event analysis | UTM [FortiOS] | Threat [PAN-OS] |
| Ingestion health & throughput | Ingest [FortiOS] | Ingest [PAN-OS] |
| Stream schema explorer | Streams [FortiOS] | Streams [PAN-OS] |
| Full Dataset & ECS Mapping | Log Fields [FortiOS] | Log Fields [PAN-OS] |
Traffic and UTM / Threat dashboards are the primary analysis tools.
Ingest and Streams are operational dashboards for understanding what data you have and how it's flowing in.
Log Fields are a reference guide showing raw datasets, original log field names and their meanings, and translated ECS fields mapping.
FortiGate extras
FortiOS includes 2 additional dashboards related to the event dataset.
- SSL VPN
- System: covering Health, Configuration Changes and Logging Attempts
Navigation

Each dashboard includes a navigation bar that links to related dashboards within the same vendor dataset. Navigation links are tag-based — each link resolves dynamically to all dashboards sharing a specific set of Grafana tags, so new dashboards added with the right tags appear automatically.
| Nav Link | FortiGate dashboards | PAN-OS dashboards |
|---|---|---|
| Data | Ingest [FortiOS], Streams [FortiOS], Log Fields [FortiOS] | Ingest [PAN-OS], Streams [PAN-OS], Log Fields [PAN-OS] |
| Traffic | Traffic [FortiOS] | Traffic [PAN-OS] |
| UTM / Threat | UTM [FortiOS] | Threat [PAN-OS] |
| Event | System [FortiOS], SSL VPN [FortiOS] | — |
Variables & Filters

All dashboard filters are exposed at the top of the page, allowing you to slice and dice the data as needed. Variables are ordered hierarchically — selecting a firewall narrows down vdom/vsys options, which narrows down subtypes, and so on.
Both vendors follow the same variable cascade — each level is scoped by the one above:
datasource
└─ Filters ·············· ad-hoc filter on any field
   └─ firewall ·········· populated from data
      └─ vdom / vsys ···· scoped to selected firewall
         └─ type ········· hardcoded per dashboard
            └─ subtype ··· scoped to type
               └─ direction
                  └─ action ········· scoped to all above
                     └─ Logsql ······ free-form LogsQL injection
| Variable | FortiGate field | Palo Alto field | Notes |
|---|---|---|---|
datasource | — | — | Victoria Logs connection |
Filters | — | — | Ad-hoc filter on any field |
firewall | log.syslog.hostname | panos.device_name | Multi-select |
vdom / vsys | fgt.vd | panos.vsys | Virtual domain / Virtual system |
type | fgt.type | panos.type | Hardcoded per dashboard (traffic, utm/threat, …) |
subtype | fgt.subtype | panos.subtype | Populated from data |
direction | network.direction | network.direction | outbound, inbound, internal, external |
action | fgt.action | panos.action | Populated from data |
Logsql | — | — | Raw LogsQL injection — applied after all other filters |
FortiGate extras
FortiGate Traffic dashboards have two additional variables not present in PAN-OS:
policytype(filters byfgt.policytype)crscore, a toggle that applies a risk score threshold filter.
Advanced Filtering
The Logsql variable lets you inject raw LogsQL into every query. Use it for complex filters that aren't covered by the standard variables, such as:
Base Query Shell
All panels in a dashboard share a common base query structure. It always has three parts:
Stream block — narrows the search to a pre-defined log stream. Streams are declared at ingestion time via _stream_fields in the Vector sink config — VictoriaLogs stores each stream separately, making the stream filter the fastest part of any query.
Filter block — applies additional filters (mainly $action) and custom LogsQL filters on top of the stream result.
Stats block — aggregates results, typically count() for sessions or sum(bytes) for volume.
_stream:{log.syslog.hostname in (${firewall:doublequote}),fgt.vd in (${vdom:doublequote}),fgt.type=${type:doublequote},fgt.subtype=${subtype:doublequote},fgt.policytype=${policytype:doublequote},network.direction in (${direction:doublequote}),fgt.logid!=0000000020}
| fgt.action:in(${action:doublequote}) AND ${Logsql:raw}
| stats by (fgt.srccountry) count() results
| sort by (results) desc
| limit 10
_stream:{panos.device_name in(${firewall:doublequote}),panos.vsys in(${vsys:doublequote}),panos.type=${type:doublequote},panos.subtype in(${subtype:doublequote}),network.direction=${direction:doublequote}}
| panos.action:in(${action:doublequote}) AND ${Logsql:raw}
| stats by (panos.srcloc) count() results
| sort by (results) desc
| limit 10
Tab Structure
Top-level Tabs: Direction
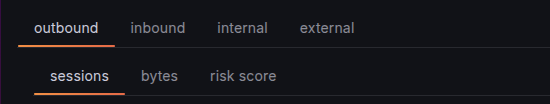
We segment the analysis by network.direction — tabs across the top represent different traffic directions:
- Outbound — Traffic initiated from internal networks going out
- Inbound — Traffic coming from external networks into internal
- Internal — Traffic between internal network segments
- External — Traffic between external networks (rare but possible)
The segmentation matters: an attack originating from the internet is completely different from an internal host generating suspicious traffic.
Sub Tabs — Traffic Dashboard: Metrics
Within each direction tab, the Traffic dashboard splits analysis by metric:
| Sub-tab | Aggregation | Notes |
|---|---|---|
| Sessions | count() | 1 log ≈ 1 connection. Not 100% accurate but cheap to calculate. For exact counts, count_uniq(session.id) is resource-intensive |
| Bytes | sum, avg, p90,histogram for network.bytes and avg, p90,histogram for duration | Total volume transferred |
| Risk Score | sum(fgt.crscore) | Arbitrary score about the risk associated to a specific session. Only FortiGate |
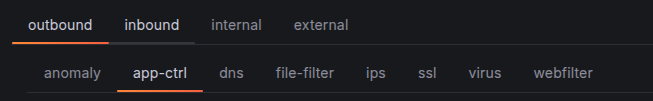
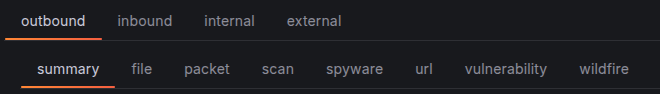
Sub Tabs — UTM / Threat Dashboard: Subtype
The UTM (FortiGate) and Threat (Palo Alto) dashboards split by subtype — the category of security engine that generated the event.
- A summary tab — aggregated view across all subtypes. Only Palo Alto
- A dynamic per-subtype tab — automatically adapts to whatever subtypes are present in your data
Panel Hierarchy
Traffic
Within each tab of the Traffic dashboard (both vendors), panels follow a consistent top-to-bottom layout:
| Row | Content |
|---|---|
| Metrics | Summary stats — total sessions, bytes, unique IPs |
| Action | Allow/block split — timeseries and bar breakdowns by action |
| Geo | Country geomaps — source and destination geographic distribution |
| Rule | Policy attribution — which firewall rules are matching traffic |
| Interfaces | Interface/zone metrics — traffic by interface or security zone |
| Source | Destination | IP analytics — top sources, destinations, unique counts |
| Application | Service & app details — ports, protocols, detected applications |
This structure lets analysts quickly identify anomalies at the top, investigate at the middle, and drill down into specific entities at the bottom — following the top-to-bottom details philosophy.
UTM / Threat
The UTM (FortiGate) and Threat (PAN-OS) dashboards share the same top rows (Metrics, Action, Geo, Source|Destination, Application) but differ in the threat-specific rows.
FortiGate UTM — rows are shown or hidden based on the active subtype:
| Row | Always visible | Visible when subtype is… |
|---|---|---|
| Metrics | ✓ | — |
| General | ✓ | — |
| Geo | ✓ | — |
| Source | Destination | ✓ | — |
| User Agent | URL | Category | app-ctrl, webfilter, file-filter, ssl | |
| Application | Application Category | app-ctrl | |
| File | Virus | Virus Category | virus | |
| Attack | Severity | URL | ips | |
| Resolved IP | Question Name | dns | |
| matchfilename | matchfiletype | file-filter |
PAN-OS Threat — all rows are always visible; scope is driven by the direction and subtype tab selection rather than conditional rendering:
| Row | Notes |
|---|---|
| Metrics | Always visible |
| Subtype | Always visible |
| Rule | Always visible |
| Geo | Always visible |
| Threat ID | Threat Category | Misc | Always visible |
| Source | Destination | Always visible |
| Application | Always visible |
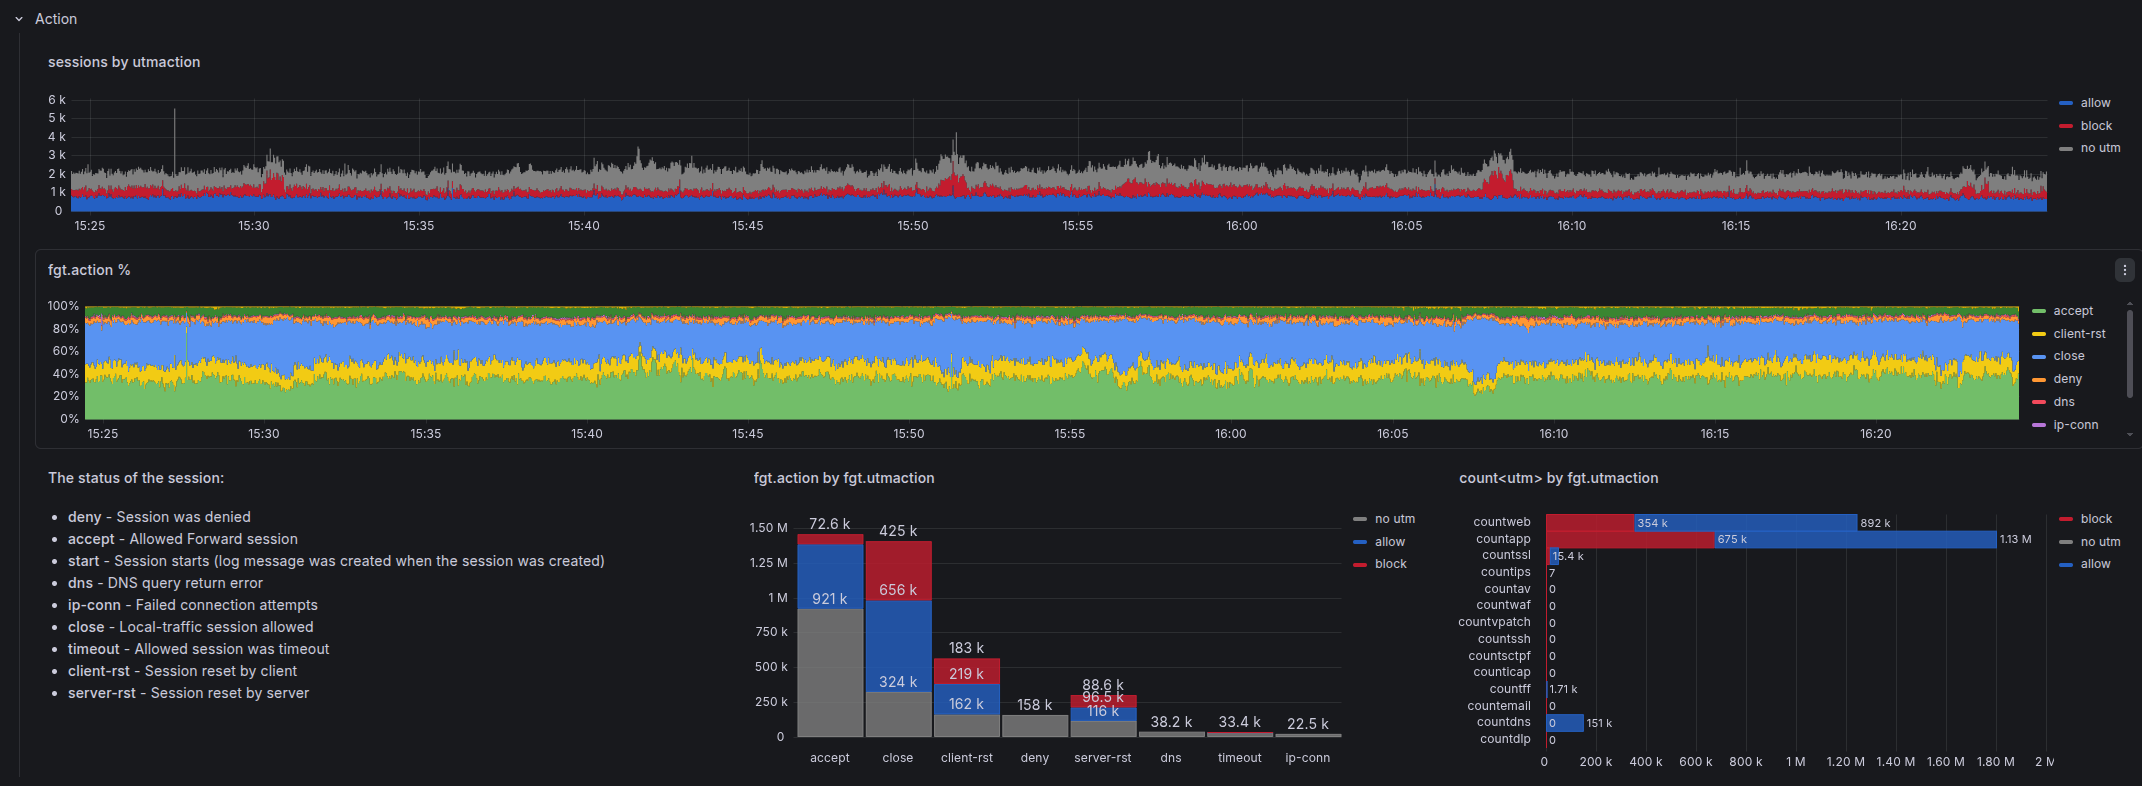
Action
Why do you buy a firewall in the first place??? To block!
Understanding what action your firewall took for each connection is the most relevant piece of information for security analysis. Every investigation starts here: "What did the firewall do?"
This is why every bar chart across both Traffic and UTM / Threat dashboards is broken down by action — whether a session was allowed or blocked is always the first dimension of any analysis.
For Traffic, action has vendor-specific nuance — each vendor models policy decisions, security engine outcomes, and session termination differently:
| FortiGate | Palo Alto | |
|---|---|---|
| Policy action | fgt.action — what the policy decided, or how the connection ended if allowed | panos.action — what the firewall policy decided |
| Security engine | fgt.utmaction — action taken by the UTM engine (web filter, AV, IPS…) | look up in the Threat dashboard when panos.session_end_reason = threat |
| Session termination | (part of fgt.action for closed sessions) | panos.session_end_reason — why the session ended, separate from policy action |
For vendor-specific action visualizations, action values, and color coding: FortiGate · Palo Alto
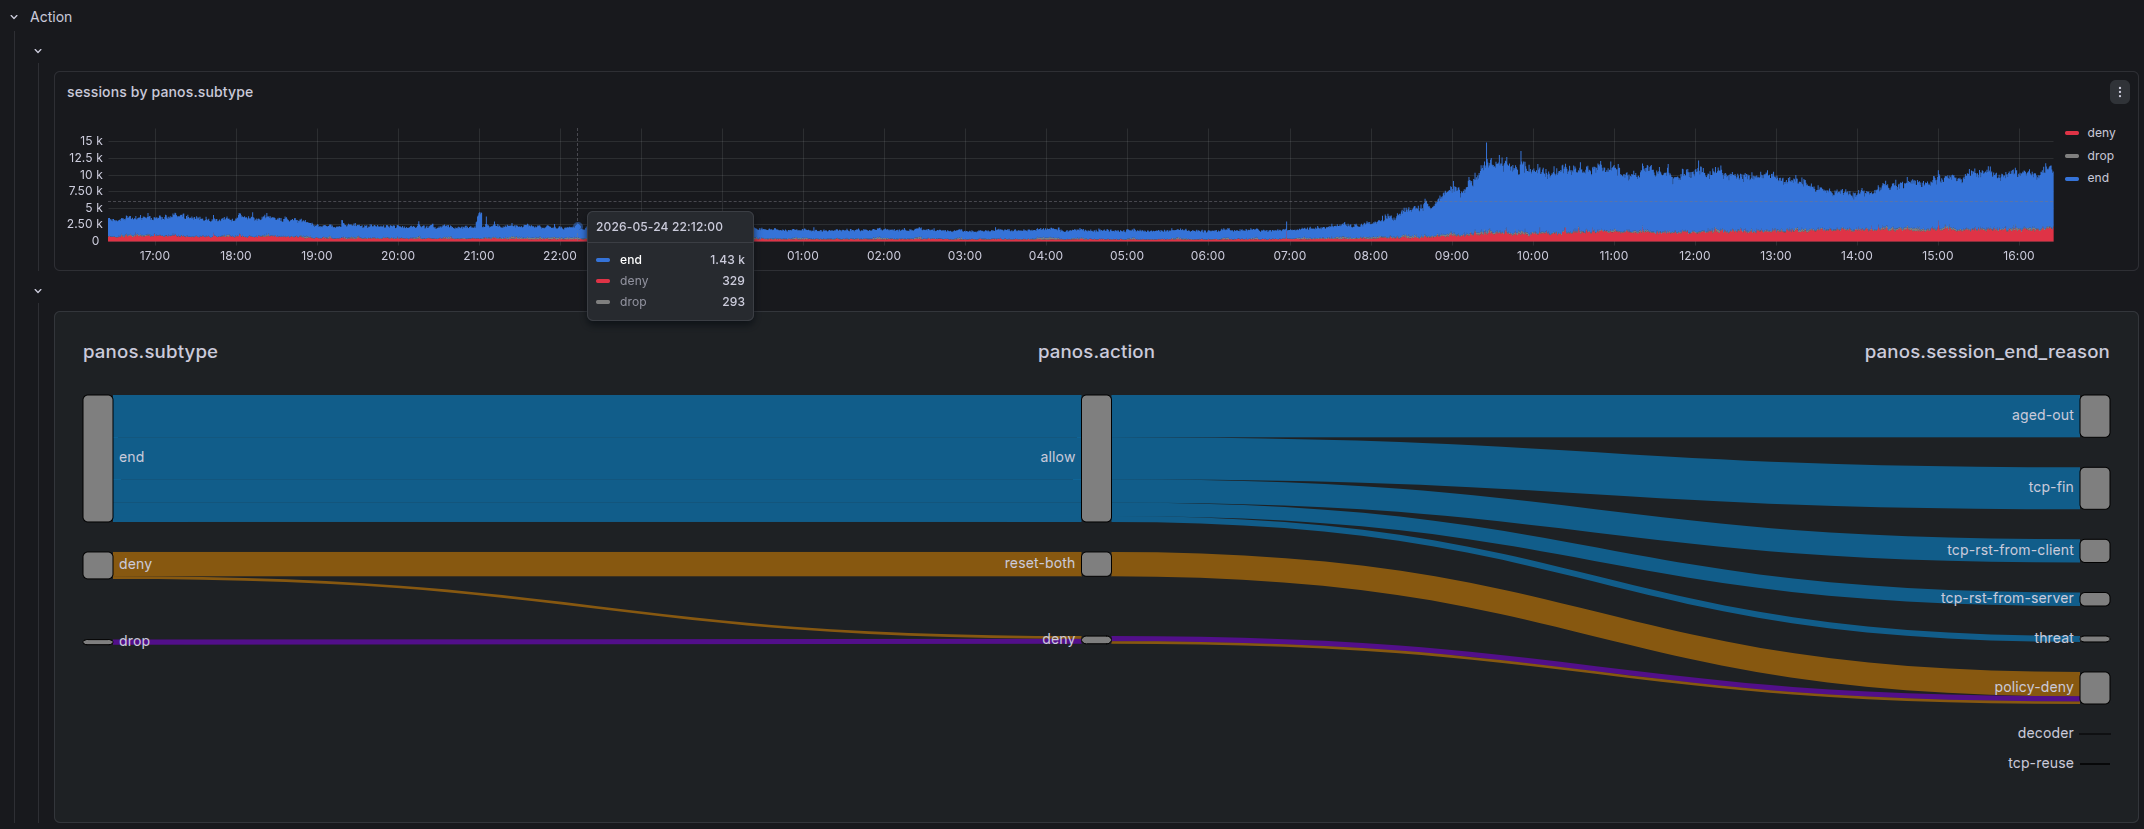
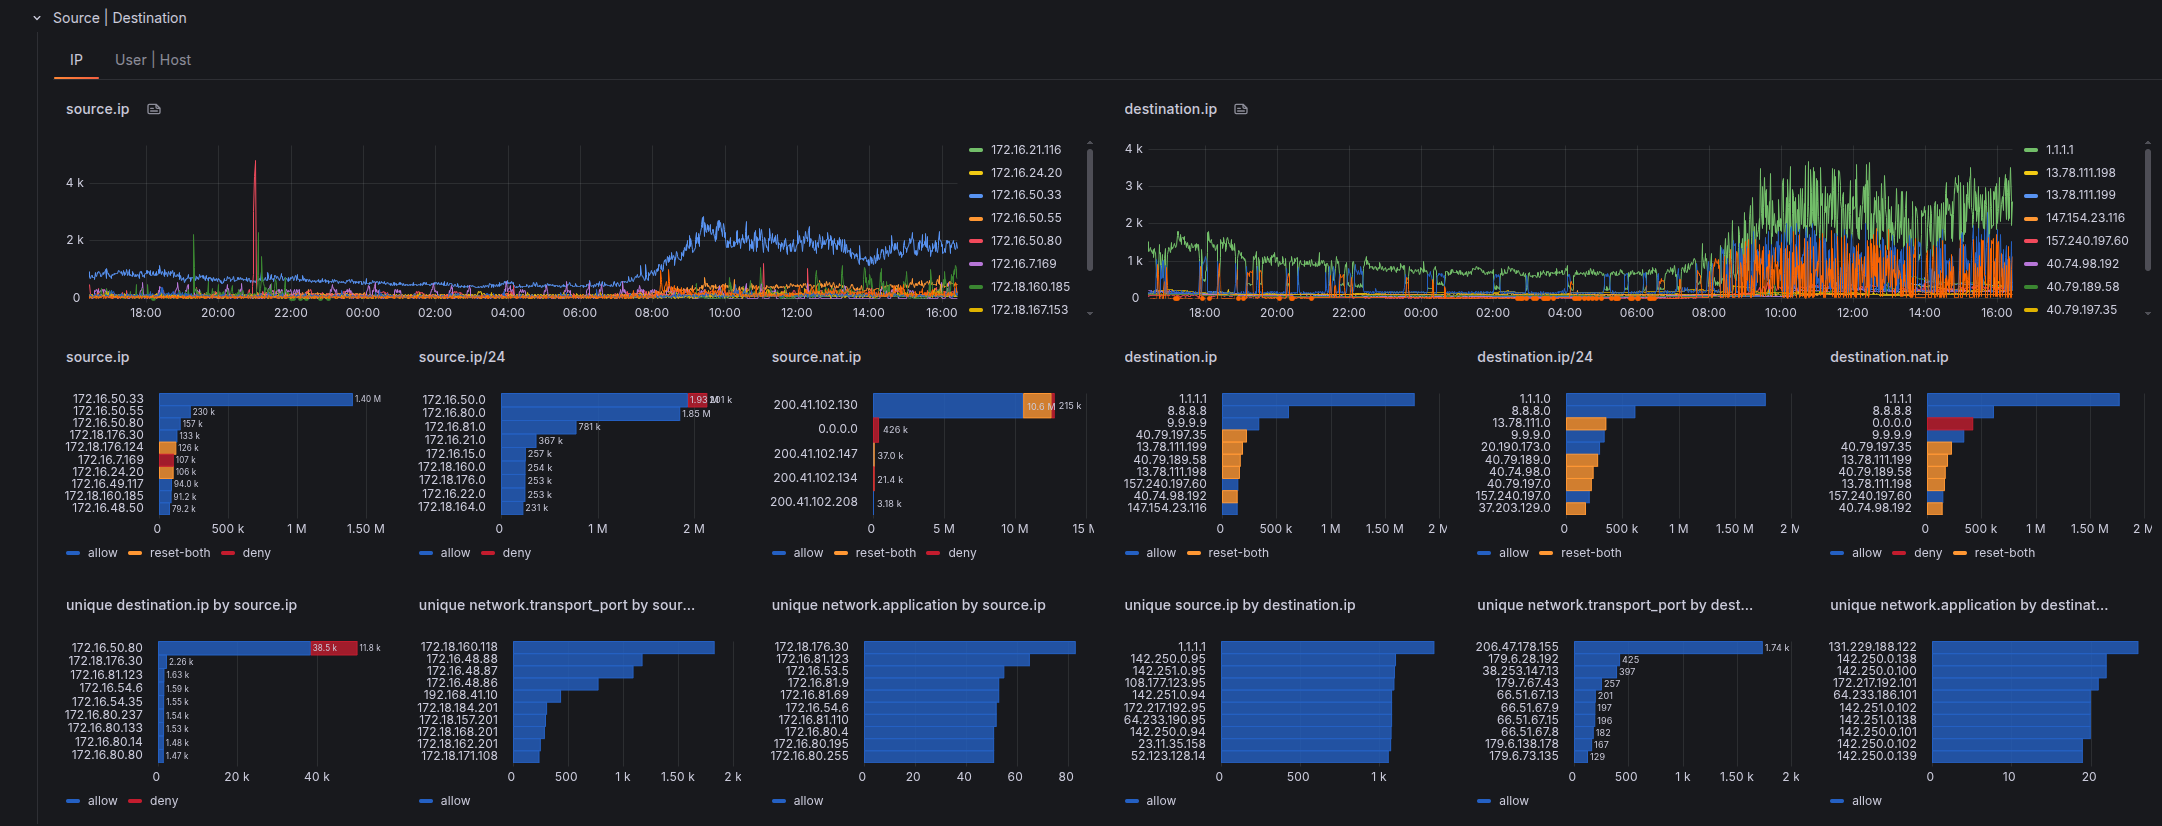
Source | Destination
We dig further into the most elemental dimensions of a network connection: Source and Destination.
We explore its broadest dimensions: IP, User, Device.
- Top row — timeline analysis
- Middle row — total aggregated values:
count of logs over the whole time window - Bottom row — advanced metrics:
unique count of destination IP per source IP
For vendor-specific views: FortiGate · Palo Alto
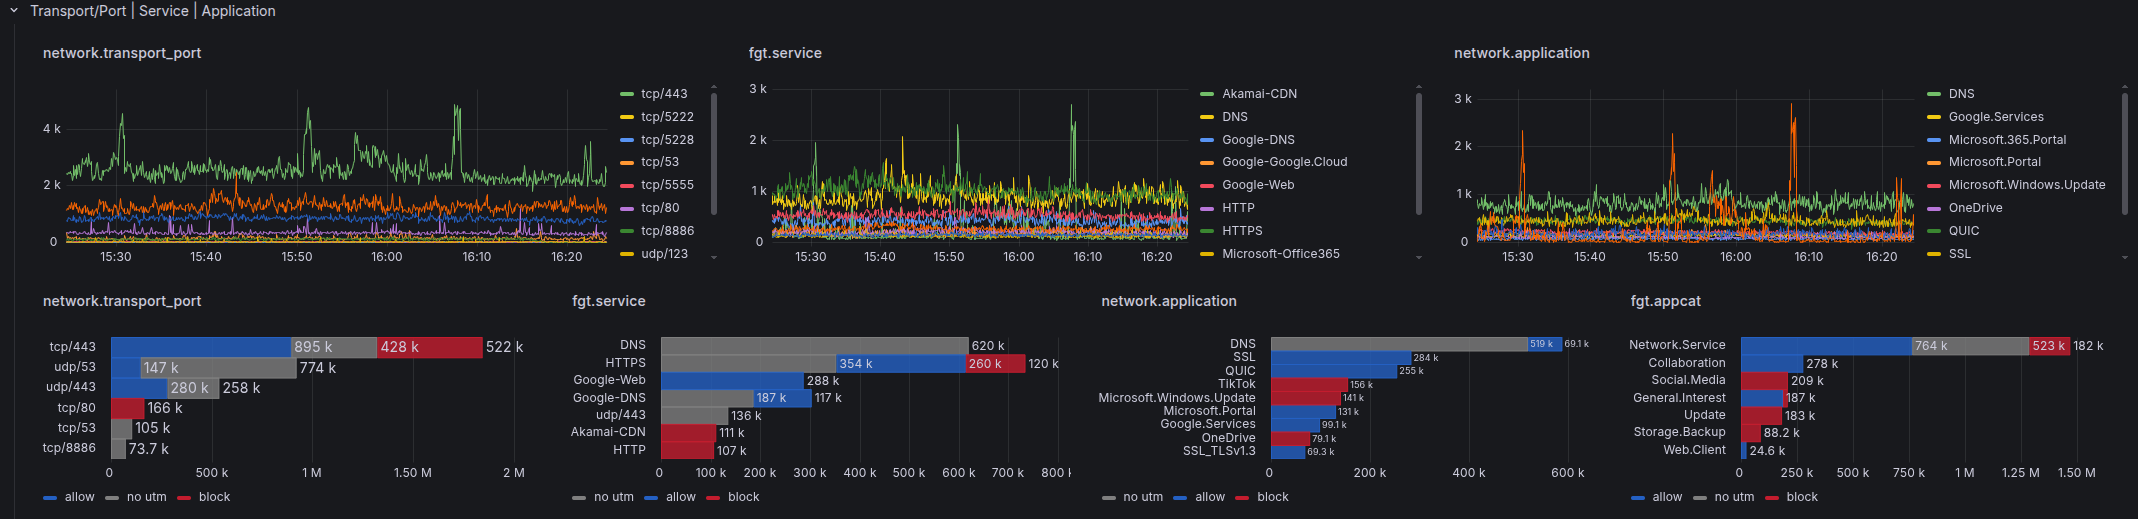
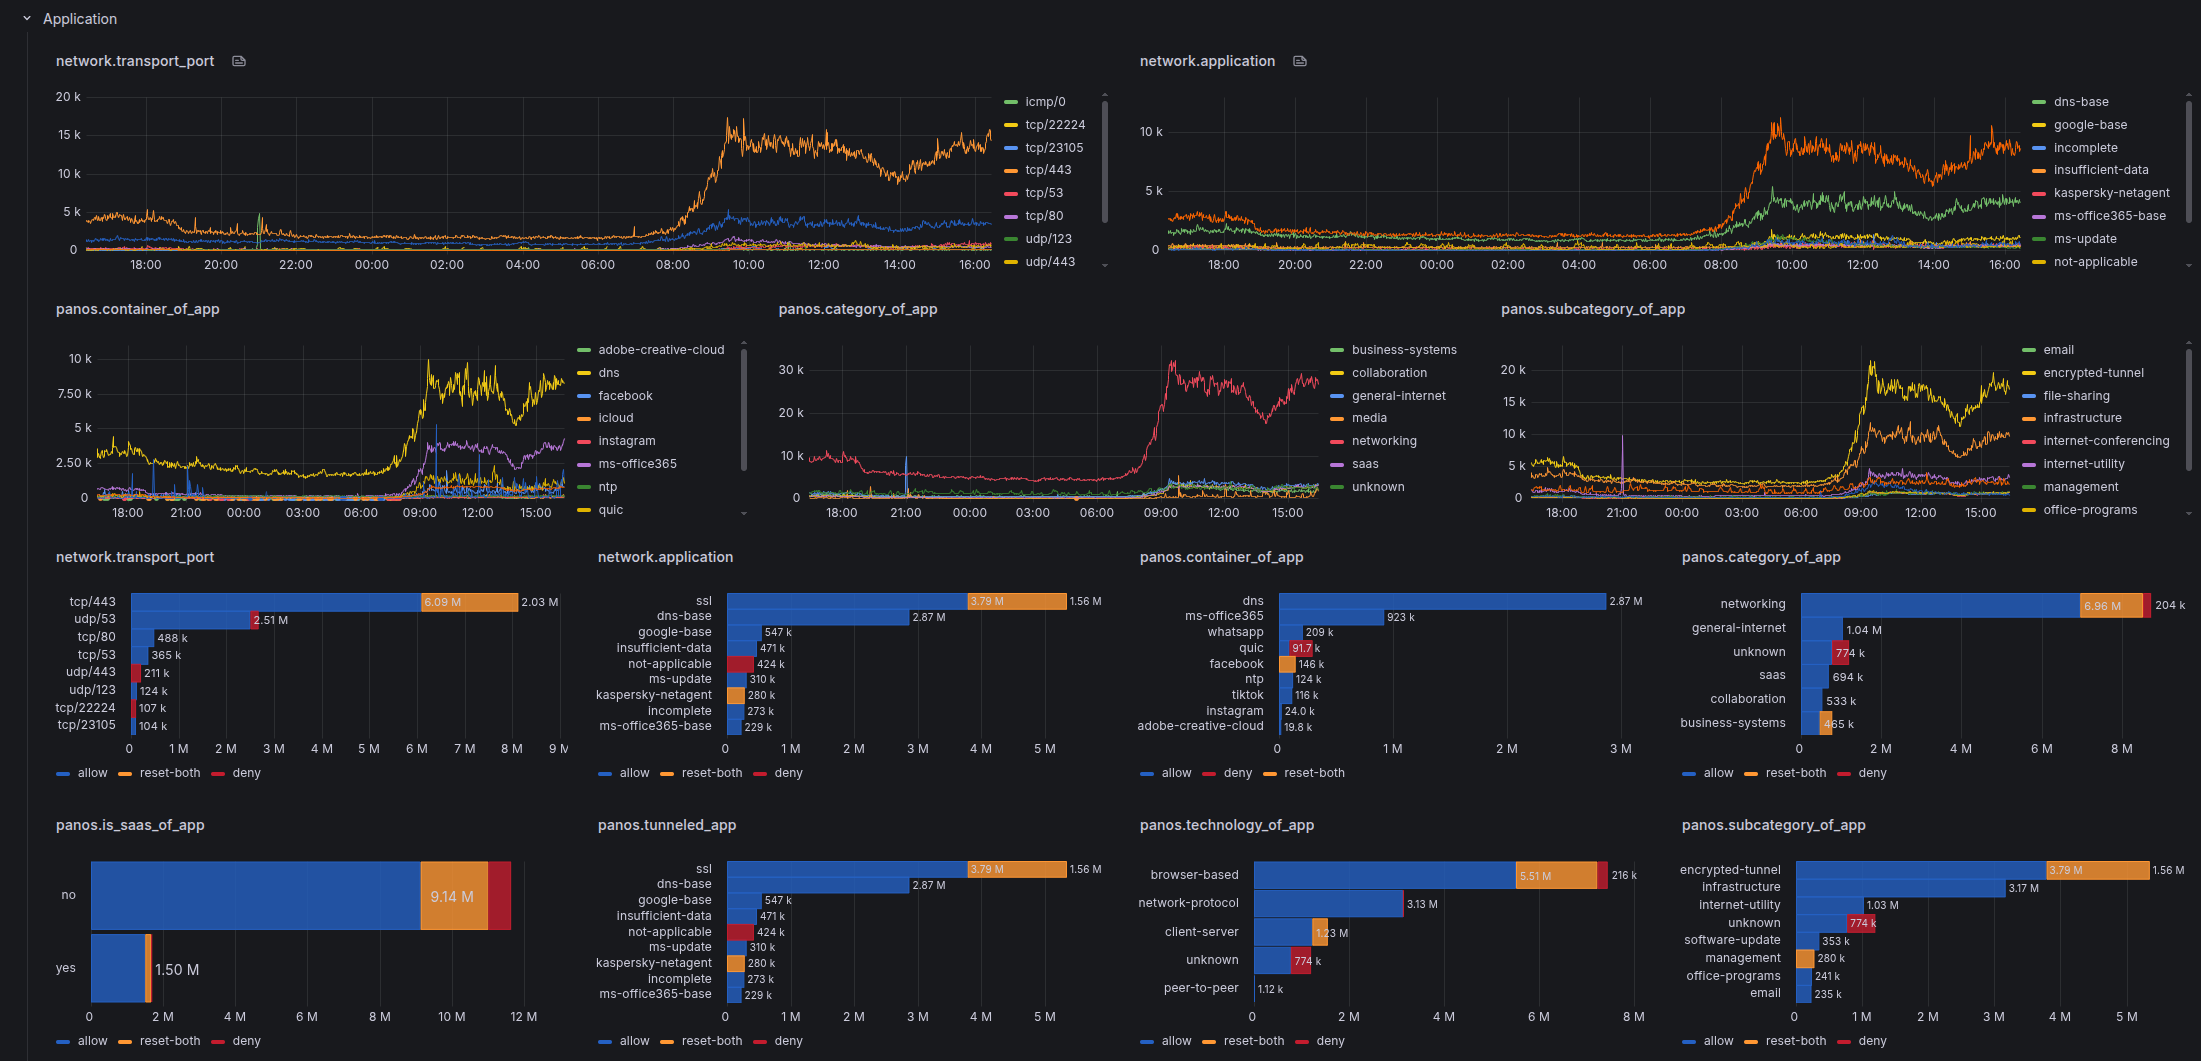
Application
network.transport_port
We normalize both vendors into a single computed field:
E.g.tcp/443, udp/53 This field is computed at ingestion time in the Vector transform pipelines (vector/fortigate.yaml, vector/panos.yaml) and is consistent across both vendors.
Application Metadata
Application visibility depth differs significantly between vendors:
| FortiGate | Palo Alto | |
|---|---|---|
| App name | fgt.app (network.application) | panos.app (network.application) |
| Category | fgt.appcat | panos.category_of_app |
| Sub-category | — | panos.subcategory_of_app |
| Technology | — | panos.technology_of_app |
| Risk level | — | panos.risk_of_app |
| Characteristics | — | panos.characteristic_of_app |
| Container app | — | panos.container_of_app |
| Tunneled app | — | panos.tunneled_app |
| SaaS | — | panos.is_saas_of_app |
| Sanctioned | — | panos.sanctioned_state_of_app |
Palo Alto's deep packet inspection engine classifies applications with much richer metadata, while FortiGate provides name and category only.
For vendor-specific visualizations: FortiGate · Palo Alto